Rising Optimism and Stock Market
By Frank Salb, CFA
The U.S. economy and markets continued to show considerable strength in the first quarter of 2024, following up on a strong recovery in 2023. The S&P 500 is now up 47 percent from the lows experienced during the 2022 decline. The market gains have been driven by a resilient economy that has produced an acceleration in earnings and an increase in valuations. The outlook of the Federal Reserve (Fed) on interest rate cuts has been key to investor optimism driving markets and valuations steadily higher.
Economy
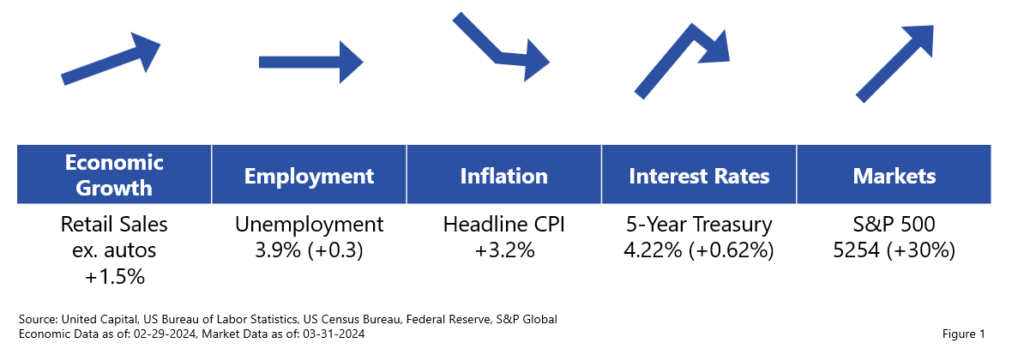
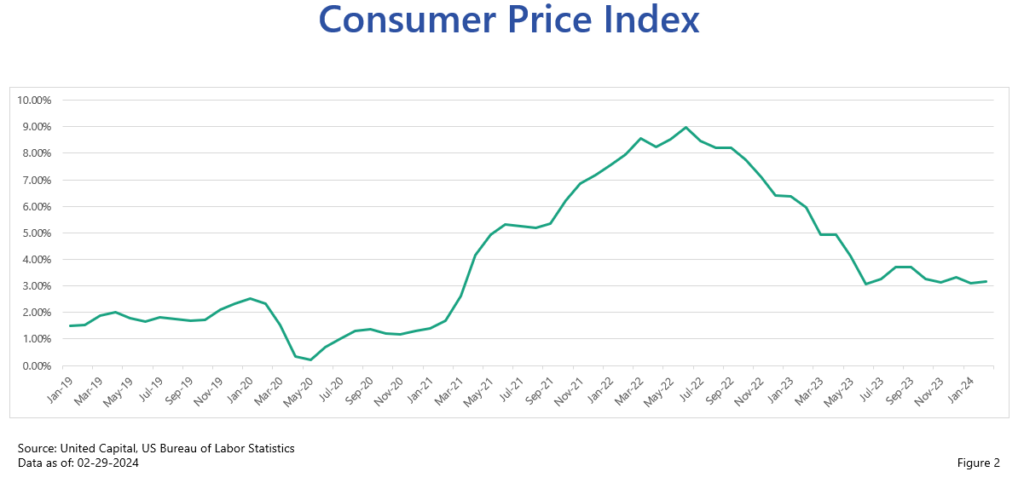
Last quarter we discussed how we were nearing the end of the “economic wave” created by COVID-19; the past year has been a period of stabilization of economic metrics back near long-term norms. There were significant risks that the economy could falter during this period of deceleration, but thus far we have seen a resilient economy. Inflation has been a hot topic during the last three years, and it continues to take center stage today. Inflation has followed a similar wave-like pattern but has stalled during the last nine months near 3% (and, notably, above the Fed’s 2% target). With the economy at full employment, inflation is in the driver’s seat of Fed policy. The Fed believes that the recent stall in the rate of disinflation is temporary and currently expects three rate cuts during 2024. The anticipated rate cuts have fueled gains in the stock market, and any delays by the Fed could be a catalyst to a market correction.
The market delivered a smooth ascent during the first quarter of the year, with most major return-seeking asset classes appreciating. The S&P confirmed a new bull market on January 19 and delivered a 10% return in the first quarter without experiencing a short-term drop greater than 2% from a new all-time high.
Stocks

The gains in the U.S. market were heavily driven by large growth companies within the technology and communications services sectors, particularly those included in the “Magnificent 7”: Microsoft, Amazon, Meta (Facebook), Apple, Alphabet (Google), Nvidia and Tesla. Many investors ask whether they should increase their exposure to these companies after such strong performance. Diversified portfolios already have high exposure to these companies because the S&P 500 has roughly a third of its assets in the top 10 market cap companies, which includes the previously mentioned companies. The run-up in prices has also increased the valuations on those companies, and 2022 was a good reminder of what happens when these types of companies go out of favor. As always, a diversified portfolio of assets can smooth performance over time.
Our core philosophy on markets is built on the understanding and expectation that markets will be cyclical. The stock market is arguably the best and most accessible tool for building wealth. Among the traditional three asset classes, we believe that in the long-term stocks will outperform bonds and bonds will outperform cash. Of course, this is not always true in shorter time periods. We also believe that the primary drivers of performance in the stock market are earnings over long-term time periods (decades), valuation as an important driver in the medium term (5-10 years) and sentiment causing volatility in the markets in the short-term — but to a disciplined long-term investor, it is only noise and opportunity.
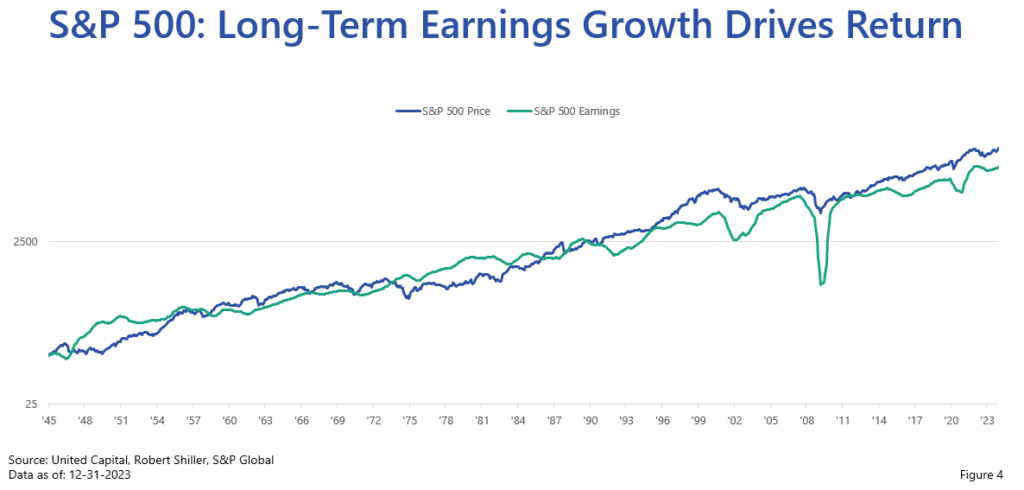
This chart shows that in the past 80 years, since the end of World War II, the S&P 500 price has grown in almost perfect lockstep with S&P 500 earnings. During that period, there are times when price grew faster than earnings or earnings grew faster than prices. This is what Warren Buffett meant when he said: “In the short run, the market is a voting machine; in the long run, the market is a weighing machine.” In other words, by buying shares investors can “vote” and move a share price higher, but in the long term the fundamental worth of the companies will bring prices back to a reasonable value in alignment with the earnings.
The difference that occurs in the intermediate term, when the change in prices deviate from the change in earnings, can be expressed as changes in valuation. In the chart, we show a 10-year cyclically adjusted price-earnings (CAPE) ratio as a reasonable example of a valuation metric. Valuation can be an important factor impacting whether future returns will be above or below long-term earnings growth.
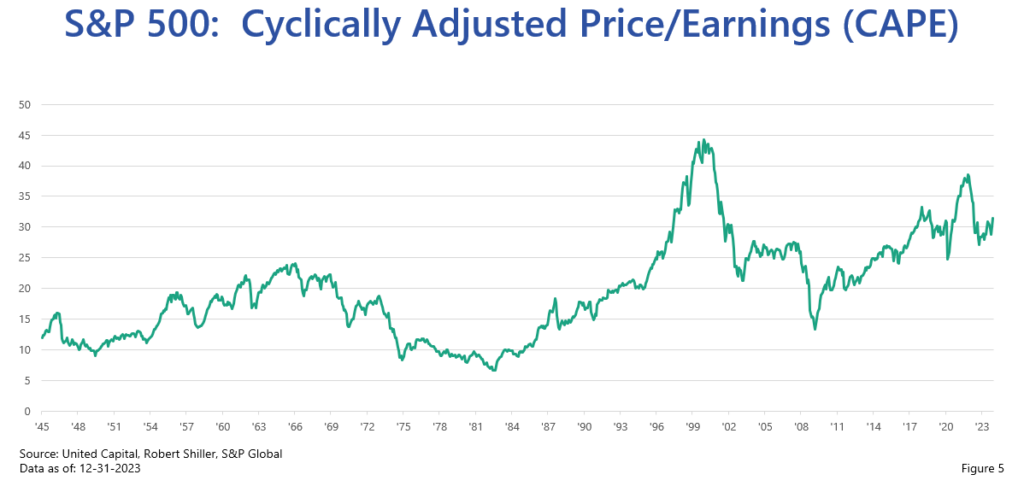
Historically, when valuations were at a low point, like in the 1980s, strong market returns have followed. Similarly, valuations were “irrationally exuberant” (a nod to Robert Shiller) in the late 1990s, which led to a lost decade of zero return from the tech bubble peak through the global financial crisis (GFC). The losses in the GFC reduced valuations to create a generational opportunity, and stocks have grown almost seven times since the low point (in roughly 15 years). The strong recovery we have had during the past 18 months is pushing valuations higher, which should be taken as a caution sign to lower expectations for return in the medium term.
Bonds

Interest rates rose in the first quarter, leading to muted gains for short-term maturities and small losses for longer-term maturity bonds. Much like earnings growth explains most of the stock market’s return, long-term bond returns are mostly explained by the yield when purchased.
Most bonds are currently trading near their highest yield in the past 10 years. With these more attractive interest rates, investors should expect to earn a 4%-6% return on bonds throughout the maturity of those bonds. This sets bonds up to fulfill their traditional role as an income generator and volatility dampener in a portfolio.
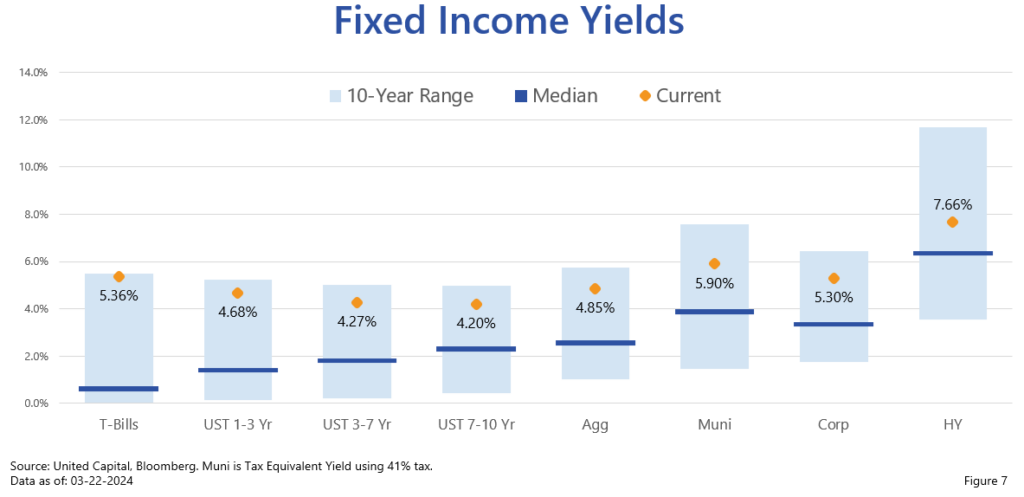
It is worth noting a yield curve is generally upward sloping, as demonstrated by the rising median yield from T-bills up through the 7- to 10-year U.S. Treasuries. However, we currently face a downward facing yield curve, as shown with the current yields from T-bills to 7- to 10-year U.S. Treasuries. This would initially make cash look like an attractive asset class, but the cash rate will begin to decline immediately when the Fed begins to drop interest rates, while longer-term Treasuries would experience a nice gain in price if their yields also fell. High-yield spreads are near their lowest levels, which makes owning higher-quality bonds attractive.
The stock market has delivered an exceptionally strong recovery and expansion during the past 18 months, while the bond market continues to hover near the highest level of yields in a decade. As a result, valuations in stocks are a bit on the expensive side, while bonds are looking inexpensive. This creates a compelling opportunity to practice disciplined rebalancing, explore tax-loss harvesting in existing bond positions or consider a reduction in risk exposure if your life circumstances are bringing you closer to needing more liquidity in your portfolio. Your United Capital Wealth Advisor can help you to navigate these decisions and help position your portfolio for the future.
Frank Salb is the Chief Investment Officer of United Capital. He has more than two decades of experience working in the investment industry, from individual financial planning to performing equity research at a large mutual fund company. He has led the investment department of a large institutional retirement plan consultant and served as the investment consultant to sophisticated C-suite retirement plan committees.
Frank received his Bachelor of Science degree in business administration (with a major in finance and a minor in economics) from Kansas State University. He also earned his Chartered Financial Analyst® designation from the CFA Institute.